


Most innovation dashboards are built to answer one question: did we make money? Fair question for a CFO. Terrible early-warning system. By the time ROI shows up — or doesn't — the decisions that caused it happened six to eighteen months earlier. You're reading a lagging indicator and treating it like a steering wheel.
Programs that stay healthy over multiple years tend to measure something different. They track how fast the system learns — how quickly ideas turn into tested assumptions, how often a past experiment saves a team from redoing work, how long it takes to go from "we're curious about this" to "we have an answer we trust." These are learning metrics for innovation, and they behave more like leading indicators. They move before the money does.
This article is about building that measurement layer: worked definitions, collection methods that don't require a data science team, and dashboards that combine the slow-moving outcome metrics everyone already reports with the fast-moving learning signals almost nobody tracks.
Why ROI-Only Measurement Quietly Breaks Innovation Programs
There's a pattern that shows up constantly. A program launches, leadership asks for ROI, and the team builds a dashboard around funded pilots and realized savings. For the first year it looks fine — there's usually a backlog of low-hanging fruit. Then growth flattens, the dashboard goes flat with it, and nobody can explain why, because the dashboard never actually measured the mechanism that produces outcomes.
ROI is an output of a learning engine. If the engine runs well, outcomes follow. If you only measure outputs, you're flying by looking at the exhaust instead of the engine temperature. A team can be learning faster every quarter — running sharper experiments, reusing prior work, killing bad ideas earlier — and the ROI line won't reflect any of that for three or four quarters.
The deeper problem is behavioral. When ROI is the only scoreboard, teams optimize for the appearance of wins. They avoid risky bets, over-invest in ideas that are already de-risked, and quietly stop reporting failures. That last one is the killer. Failed experiments are where most of the learning lives. A program that only measures ROI slowly trains itself to stop surfacing failure, and the metric that was supposed to protect value ends up eroding it.
None of this means ROI is useless. It means ROI is a lagging indicator that needs leading indicators beside it. We've written separately about building the executive ROI dashboard and conversion formulas — this piece is the other half of that story: the predictive signals that tell you whether those ROI numbers will actually be there a year from now.
The Four Learning Metrics Worth Defining Properly
There's a lot of vague talk about "learning culture." Vague metrics produce vague behavior. So let's define four learning metrics precisely enough that two different people would collect them the same way. Precision matters here more than elegance — a metric nobody can compute consistently is worse than no metric at all.
Capture, evaluate, and act on ideas without friction.
GoIdeafy streamlines the entire innovation lifecycle from idea submission to implementation.
- Centralized idea capture
- Collaborative evaluation tools
- Progress tracking & analytics
No credit card required
1. Learning Rate
Worked definition: the number of resolved assumptions per unit of time. An assumption is "resolved" when an experiment produces enough evidence to move it from unknown to validated or invalidated. Count both outcomes. An invalidated assumption counts exactly the same as a validated one — that's the whole point.
Collection method: this depends on experiments declaring their assumptions up front. Each experiment record lists the one to three assumptions it's testing. When the experiment closes, the owner marks each assumption as validated, invalidated, or inconclusive. Learning rate is (validated + invalidated) / month. Inconclusive results are excluded from the numerator on purpose — they didn't resolve anything.
The common mistake is counting completed experiments instead of resolved assumptions. A team can close ten experiments and resolve almost nothing because every test was mushy, hedged, or designed to confirm what they already believed. Counting assumptions forces honesty about whether the work actually reduced uncertainty.
2. Hypothesis Throughput
Worked definition: the number of distinct, testable hypotheses that enter active validation per period. This measures the front of your learning pipeline — how many real bets you're willing to put under test, not how many ideas sit in a backlog.
Collection method: track hypotheses at the stage transition from "triaged" to "in validation." A hypothesis qualifies only if it's written in testable form — a predicted direction, a rough threshold, and a way to measure it. Loose ideas don't count. The ratio of hypothesis throughput to learning rate tells you something useful: if you're starting far more hypotheses than you're resolving, you have a validation bottleneck, not an idea shortage.
A typical example looks like this: a program generates 40 ideas a month but only 6 become testable hypotheses, and only 3 resolve. That's not an ideation problem — that's a conversion and capacity problem downstream, and more brainstorming won't fix it.
3. Time-to-Insight
Worked definition: elapsed calendar time from when a hypothesis enters validation to when its core assumption is resolved. Measure in calendar days, not working days, because the delays that kill learning speed are almost always waiting — waiting for approval, for data access, for a stakeholder, for a tool.
Collection method: timestamp two events: validationstarted and assumptionresolved. Time-to-insight is the delta. Report the median, not the mean — a couple of multi-month experiments will drag the average and hide the typical experience. Then break the total into waiting time versus active work. In most programs, waiting accounts for somewhere between 60 and 80 percent of the clock. That split is often more actionable than the total number.
What people miss: shortening time-to-insight is rarely about running experiments faster. It's about removing the queues between steps. The experiment itself might take four days of actual work spread across five weeks of calendar time.
4. Reuse Index
Worked definition: the share of new experiments or ideas that explicitly build on a documented prior experiment — by reusing a method, inheriting a result, or avoiding a known dead end.
Collection method: add a single required field to every new experiment record: "Does this build on a prior experiment? (link)." Reuse index is experiments-with-a-prior-reference / total new experiments. It's crude, and that's fine — the number matters less than its trend. A rising reuse index means your institutional memory is compounding. A flat one near zero means every team is starting from scratch, which is the most expensive way to run an innovation program.
Reuse is the metric that most directly predicts cost efficiency over time, and it's almost always the one missing entirely. A program that doesn't measure reuse is usually paying to re-learn the same few lessons every year.
A Side-by-Side View: Leading vs Lagging
The point isn't to pick leading over lagging. It's to see them together, so a leading signal can be read as a prediction of a lagging one.
| Metric | Type | What it tells you | How early it moves |
|---|---|---|---|
| Learning rate | Leading | Is the engine resolving uncertainty? | Weeks |
| Hypothesis throughput | Leading | Are we feeding the pipeline real bets? | Weeks |
| Time-to-insight | Leading | How fast can we get an answer we trust? | Days–weeks |
| Reuse index | Leading | Is knowledge compounding or evaporating? | Quarters |
| Pilots funded | Lagging | Did learning convert to committed bets? | 1–2 quarters |
| Realized savings / revenue | Lagging | Did bets convert to value? | 2–4 quarters |
| Adoption / sustained outcomes | Lagging | Did value actually stick? | 3–6+ quarters |
The relationship worth internalizing: when learning rate and time-to-insight improve for two quarters, funded-pilot and realized-value numbers tend to follow a couple of quarters later. When the leading metrics stall, the lagging ones are about to — you just can't see it yet on the ROI chart.
How to Actually Collect This Without a Data Team
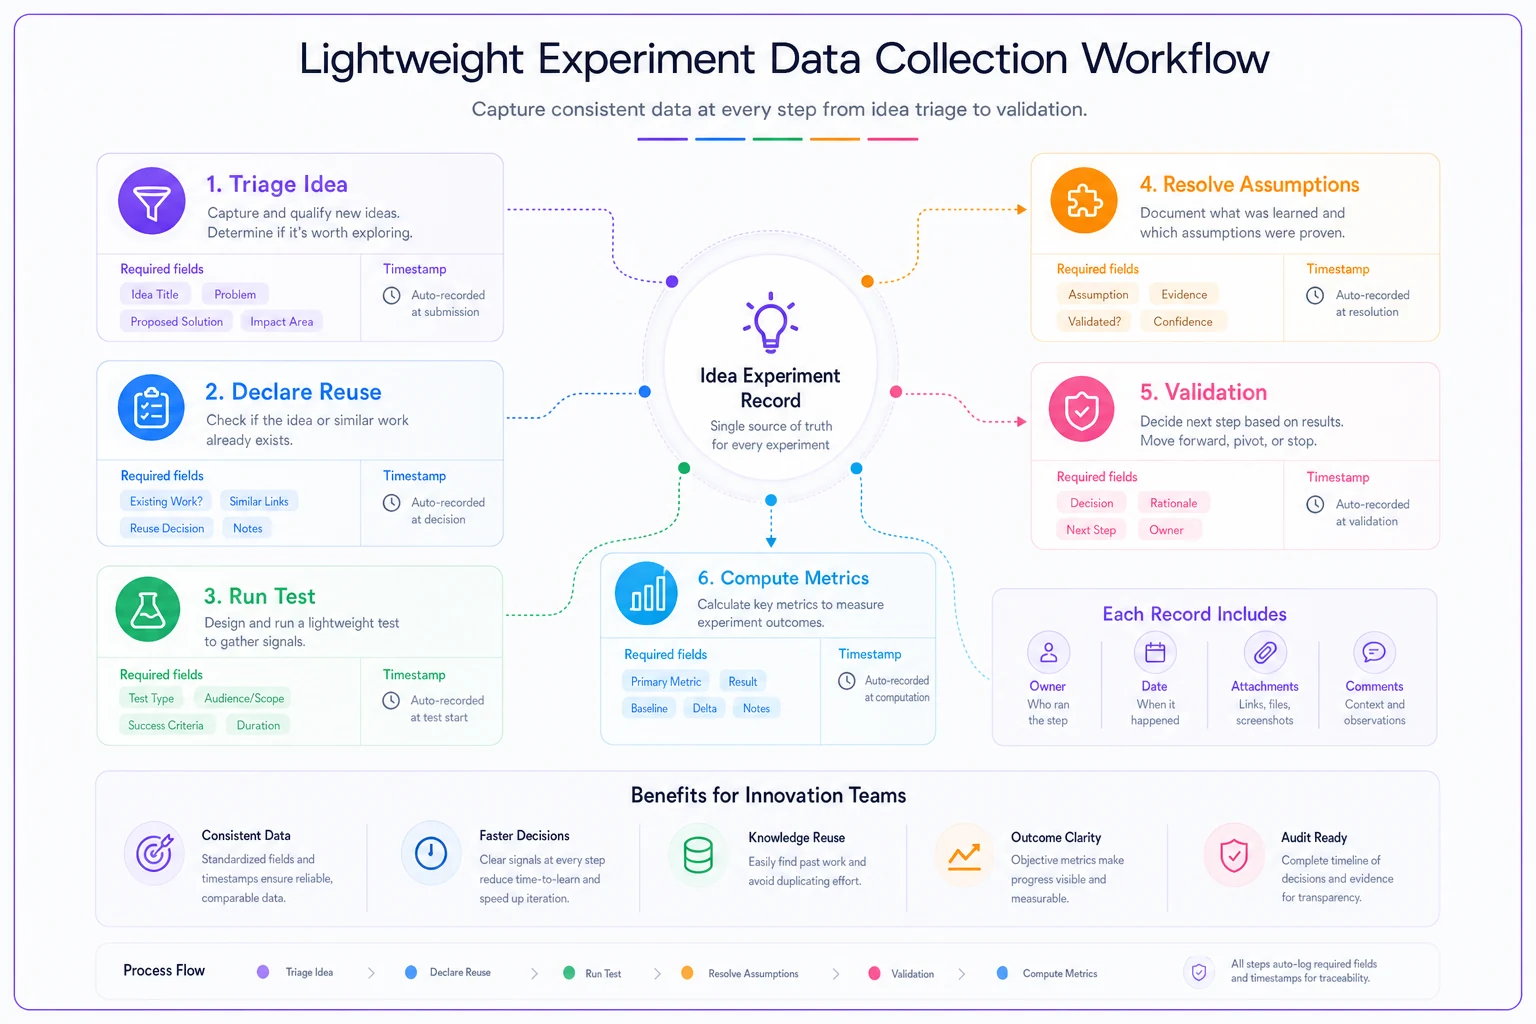
The biggest objection to learning metrics is "we don't have the instrumentation for this." You mostly don't need it. These four metrics ride on a handful of structured fields and two or three timestamps. Here's a lightweight collection workflow that a program of five to fifty people can run.
When an idea is triaged into validation, someone writes it as a hypothesis with its assumptions listed — that single act feeds both hypothesis throughput and, later, learning rate. The system stamps validationstarted. The owner fills the "builds on prior experiment" field, which feeds reuse index. When the experiment closes, the owner marks each assumption resolved or not and the system stamps assumptionresolved, which closes the loop on learning rate and time-to-insight. No separate reporting ritual, because the metrics are a byproduct of doing the work properly.
Here's the minimal data you need captured per experiment:
-
Hypothesis statement (testable form — direction, rough threshold, measurement)
-
Assumptions tested (1–3, each resolvable)
-
Prior-experiment reference (link or "none")
-
validation_startedtimestamp -
assumption_resolvedtimestamp (per assumption) -
Resolution status (validated / invalidated / inconclusive)
-
Owner and stage
If you're already running a structured experiment catalogue or idea-management tool, most of these fields can be added as required metadata rather than built from scratch. The failure mode isn't technical — it's leaving fields optional. Optional fields get skipped, and then your reuse index reads zero because nobody ever linked a prior experiment. Make the three or four fields that feed your metrics mandatory at the stage gate, and the data collects itself.
-
Triage to validation — write the hypothesis and assumptions, stamp
validation_started. -
Declare reuse — link a prior experiment or mark "none."
-
Run the test — track waiting vs active time if you can.
-
Resolve assumptions — mark each validated/invalidated/inconclusive, stamp
assumption_resolved. -
Compute at period close — four leading metrics, pulled straight from the fields above.
This loop doesn't require a new tool or a dedicated analyst. It requires discipline about fields and timestamps, which is a process problem, not a technology one.
Make the fields that feed your metrics mandatory at the stage gate.
No separate reporting ritual, because the metrics are a byproduct of doing the work properly.
Sample Dashboards That Combine Both Layers
A dashboard that only shows leading metrics confuses executives. One that only shows lagging metrics is useless for operators. The useful ones are layered by audience.
The operating dashboard (team / weekly). Front and center: hypothesis throughput, learning rate, and median time-to-insight with its waiting-vs-active split. This is the dashboard the innovation lead lives in. It answers "is our pipeline moving and where is it stuck?" The waiting-time breakdown usually becomes the week's to-do list — chase the approval, unblock the data access, reassign the stalled experiment.
The program dashboard (leadership / monthly). Pair each leading metric with the lagging metric it predicts. Learning rate and time-to-insight sit next to funded pilots. Reuse index sits next to cost-per-validated-idea. The design principle: never show a lagging number alone. Always show the leading indicator beside it so the trajectory is visible, not just the result.
The health dashboard (quarterly). This is where reuse index earns its keep, plotted as a trend over four to six quarters alongside sustained-adoption outcomes. Reuse moves slowly, so it only tells a story at quarterly resolution. A flat reuse line next to flat outcomes is a clear signal the program is re-learning instead of compounding.
One more thing worth watching: learning metrics interact with team behavior, and behavior interacts with psychological safety. Invalidated-assumption counts drop fast when people feel punished for failed tests — which means a falling learning rate can secretly be a safety problem, not a capability one. Worth reading these numbers alongside your participation and psychological-safety signals, because a team that's stopped reporting failures will show a suspiciously clean learning rate right before the program stalls.
A Real Scenario: Mid-Market Product Team
A roughly 30-person product-innovation group inside a mid-market company had a respectable-looking ROI dashboard and a growing sense that things were slowing down. They couldn't prove it, because nothing on the dashboard moved week to week.
When they added the four leading metrics, the picture clarified quickly. Hypothesis throughput was healthy — around 8 to 10 testable hypotheses entering validation a month. But learning rate was sitting at about 3 resolved assumptions a month, and median time-to-insight was close to 6 weeks, of which roughly four-fifths was waiting on data access and a single overloaded approver. Reuse index was effectively zero; nobody had ever linked a prior experiment because the field didn't exist.
They changed three things: made the prior-experiment link mandatory, pre-granted data access for low-risk experiments, and split the approver bottleneck across two people. Nothing glamorous. Over the next two quarters, median time-to-insight dropped to around 3 weeks, learning rate roughly doubled, and reuse index climbed past 20% as teams started catching dead ends from earlier work. The ROI dashboard didn't move much at first — but by the following quarter, funded pilots and validated-idea-per-dollar both ticked up, exactly the lag the model predicted.
The lesson wasn't "measure more." It was that the slowdown had been real and invisible for months, and the leading metrics made it diagnosable.
When Learning Metrics Make Sense — and When They Don't
When this actually makes sense: you're running more than a trickle of experiments — say, a handful or more per month — you have multiple teams or units that could be duplicating work, and your ROI numbers either lag badly or feel disconnected from day-to-day activity. It's also the right move when leadership keeps asking "are we getting better?" and you have no honest way to answer.
When this is a bad idea: if you're running two or three experiments a quarter, instrumenting learning rate and reuse index is overkill. You'll spend more effort measuring than learning. Just talk to each other. These metrics earn their cost at volume and across teams, not in a tiny pilot program.
Who should not do this: teams that haven't yet fixed basic experiment hygiene. If your experiments don't declare assumptions and don't close cleanly, learning metrics will produce garbage numbers that look precise and mean nothing. Get the experiment records consistent first. The metrics are a layer on top of clean records, not a substitute for them.
The Shift Worth Making
The move from ROI-only to a layered leading-and-lagging view is less about adding dashboards and more about changing what you believe a healthy program looks like. A healthy program isn't one with a big ROI number this quarter. It's one that resolves uncertainty faster each quarter, reuses what it learns, and shortens the distance between a question and a trustworthy answer. Do that consistently and the ROI takes care of itself — it's the lagging shadow of a system that actually learns.
The practical starting point is small: add four or five required fields, two timestamps, and one dashboard that refuses to show a lagging metric without its leading indicator beside it. From there, the numbers start telling you where the engine is overheating months before the exhaust gives it away.
From there, the numbers start telling you where the engine is overheating months before the exhaust gives it away.
Ready to transform your innovation process?
Join 2,000+ companies using GoIdeafy to unlock team creativity, prioritize impactful ideas, and accelerate growth.